Hey guys, welcome back.
So today, we’re going to discuss something that’s been on my mind and provide a detailed answer to some social media messages we’ve been receiving recently. What is a brew control chart? So today, we’re going to answer that question, how we can use the brew control chart to up our brewing game and how adjusting different variables will get us to that ‘ideal’ point in a coffee brew we’re looking for, as well as how to evaluate the taste and ensure our palette is learning and improving along the way.
So, let’s get started.
The Coffee Brewing Control Chart was originally developed by Ernest E. Lockhart of the Coffee Brewing Institute in 1957. It is a brewing tool used to access the quality of a brew by measuring the concentration of total dissolved solids (TDS) and extraction rate (extraction yield) which allows us to evaluate our brews, therefore being able to indicate them into segmented zones like ‘under-developed’, ‘ideal’, ‘over-developed’, ‘bitter’, ‘sour’ etc offering both objective and sensory guidance throughout our brewing journey.

Why Does it Matter
- Extraction yield (how much of the coffee solubles are dissolved) affects acidity, sweetness, and bitterness.
- TDS (brew strength) controls how concentrated and bold the cup feels.
- Staying in the Ideal Optimal Balance (commonly ~18–22 % Solubles yield (extraction) and 1.15–1.35 % TDS-total dissolved solids gives you a harmonious, flavourful brew
But Does It Actually Affect Taste?
Yes, research from UC Davis (published in SCA News, Issue 13) used 58,000 sensory data points and response-surface analysis to show:
- Bitterness & ashy notes rise sharply with high Extraction % + TDS.
- Sweetness peaks at low Extraction % + low TDS.
- Sourness and chocolate notes respond in distinct curves across the chart
So the control chart isn’t just theory—it’s a roadmap to sensory tuning.
Getting Your Brew into the Ideal Zone
- Measure Your TDS & Extraction Solubles Yield with a refractometer (plus calculator).
- Aim for:
- TDS: 1.15–1.35 %
- Extraction Yield: 18–22 %
The primary calculation needed to work out your extraction is:
TDS X weight of brewed coffee divided by the dose of dry coffee.
- Adjust key variables:
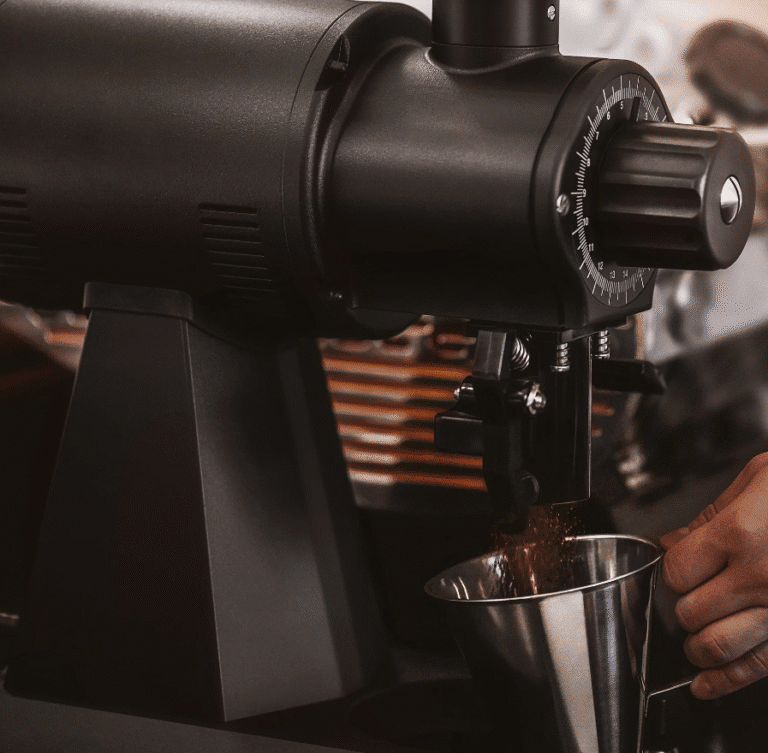
- Grind Size – finer = more extraction.
- Turbulence & Flow Rate – aggressive flow/height = deeper agitation; slow flow = gentler extraction
- Agitation – swirling or stirring improves uniformity (bloom stirring, gentle stir post-bloom)
- Track with equipment:
- difluids micro-balance scale for water and dosage precision.
- Refractometer to measure TDS.
- Control coffee quality (origin, roast) and water recipe (Lotus Water Drops, Third Wave Water).
A top tip we recommend is creating your ideal water recipe if you don’t have good water, you can buy a Zero Water Jug which takes the minerals out of your water, then put minerals like Lotus Water Drops back in to a certain recipe can make your brews thrive even more – this is exactly what we do here at Caretta Coffee.
Sample Brew Control Test
| Parameter | Target | Measured | Notes |
| Roast | Medium | Stir the bloom gently | |
| Dose (g) | 20 g | Uganda Anaerobic Natural | |
| Water (g) | 300 g (1:15) | pH 6.5 | |
| Grind setting | 20 clicks | medium to coarse on comandante c40 | |
| Bloom | 60 g @30 s | Mid brew (after pouring 3) | |
| Pour schedule | 4×60 g pulses | ~5 g/s, ~5 cm above bed | |
| Stir post-bloom | 2 gentle swirls | Measured with a refractometer | |
| Drawdown time | 3:36 | ||
| TDS (%) | 1.27 | Measured with refractometer | |
| Extraction (%) | 20.25% | Calculated from TDS |
Here is a blank test chart for you to evaluate your brews at home:
| Parameter | Target | Measured | Notes |
| Roast | |||
| Dose (g) | |||
| Water (g) | |||
| Grind setting | |||
| Bloom | |||
| Pour schedule | |||
| Stir post-bloom | |||
| Drawdown time | |||
| TDS (%) | |||
| Extraction (%) |
Next round: If your TDS is below 1.15 % try a finer grind or more turbulence (higher pour).
If your TDS is below 1.35 %, try a coarser grind or gentler pour.
Track each result to learn your system curve!

Tools to Help you Stay Consistent
- Difluids Microbalance Scale – for precise weighing of coffee and water to ±0.01 g.
- Refractometer – converts TDS measurement into extraction yield. Along with the DiFluid cafe app to help you track your brews.
- Good-quality grinder – uniform particles help avoid bypass/clogging
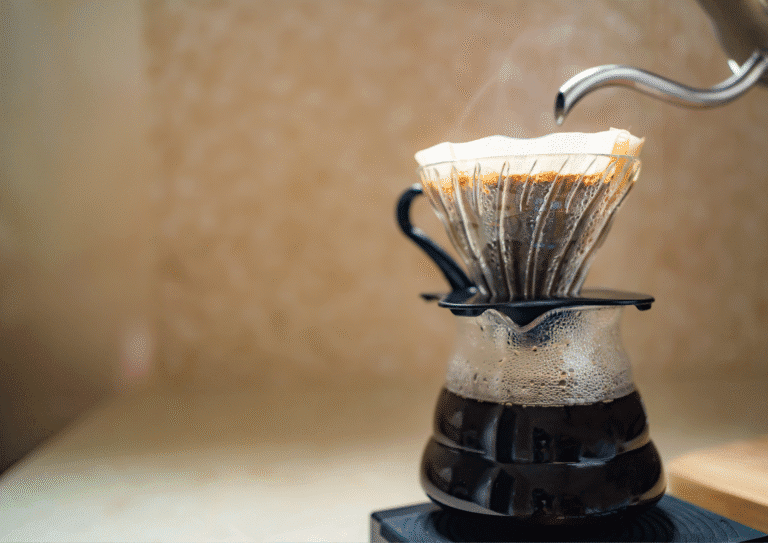
- Gooseneck kettle – fine control of flow rate and pour height.
- Water recipe – using Rao, Perger, or Third Wave Water ensures correct hardness and pH.


The Technique
- Agitation: Stir or gently swirl to help evenly wet all grounds. Bloom-phase stirring for 30–60 s can prevent channelling
- Flow Rate / Pour Height: Fast, rough pour = deep agitation; slow, smooth pour = gentle extraction. Ideal: just before splatter, creating uniform turbulence
- Coffee Quality & Roast: Bean origin & roast level shift how flavour attributes map: fruity, nutty, floral tones respond differently across TDS/Solubles Yield zones
- Water Recipe: Aim for balanced mineral content—too soft leads to flatness, too hard increases bitterness. Use a mineral-adjusted water recipe as discussed in our previous post on water quality in coffee.
Summary
The Brew Control Chart isn’t just theoretical—it’s a scientifically backed tool to tune your coffee’s sensory profile. With careful measurement, consistent technique, and equipment like a refractometer, you can dial in sweetness, balanced acidity, and minimal bitterness. Adjust grind, flow rate, and agitation until your TDS & extraction hit the Golden Zone (1.15–1.35 % TDS; 18–22 % yield).
So, give it a try, log your brews, and share your Taste vs TDS graphs with us. I’d love to feature your results in this article!
We really hope this has helped you understand your questions on brewing and extraction.
If you’re interested in other variables of filter coffee, check out our other articles here
And if you have any questions, feel free to hit us with an email: hello@carettacoffee.com
Until next time, we hope you’ve enjoyed the read
Catch you on the next one!
